Project Dashboard: The Complete Guide for 2026
Key takeaway: A project dashboard gives your team a single view of what matters right now. It replaces scattered updates with real-time visibility into progress, blockers, and priorities.
A project dashboard is a visual interface that displays the current state of work across your team or product. It pulls data from your issue tracker or roadmap system and presents it in one consolidated view.
The term means different things depending on context. Traditional project management tools use it to show Gantt charts and resource allocation. In product-led SaaS teams, it typically means a live view of engineering progress tied to customer-facing roadmaps. This guide focuses on the SaaS meaning: dashboards that connect internal execution to external visibility.
| Dashboard Type | Primary Use | Best For |
|---|---|---|
| Internal sprint dashboard | Track daily engineering work | Dev teams using Linear, Jira, Asana |
| Public roadmap dashboard | Show customers what's planned | Product teams collecting feedback |
| Portfolio dashboard | View progress across multiple projects | Executives and ops leaders |
| Changelog dashboard | Display shipped features | Customer success and marketing |
Evidence block: According to the 2024 State of Product Management report from ProductPlan, 67% of product teams now maintain some form of public-facing dashboard to communicate roadmap status. Teams with public dashboards report 23% fewer inbound "when will X ship?" support tickets.
What Is Project Dashboard?
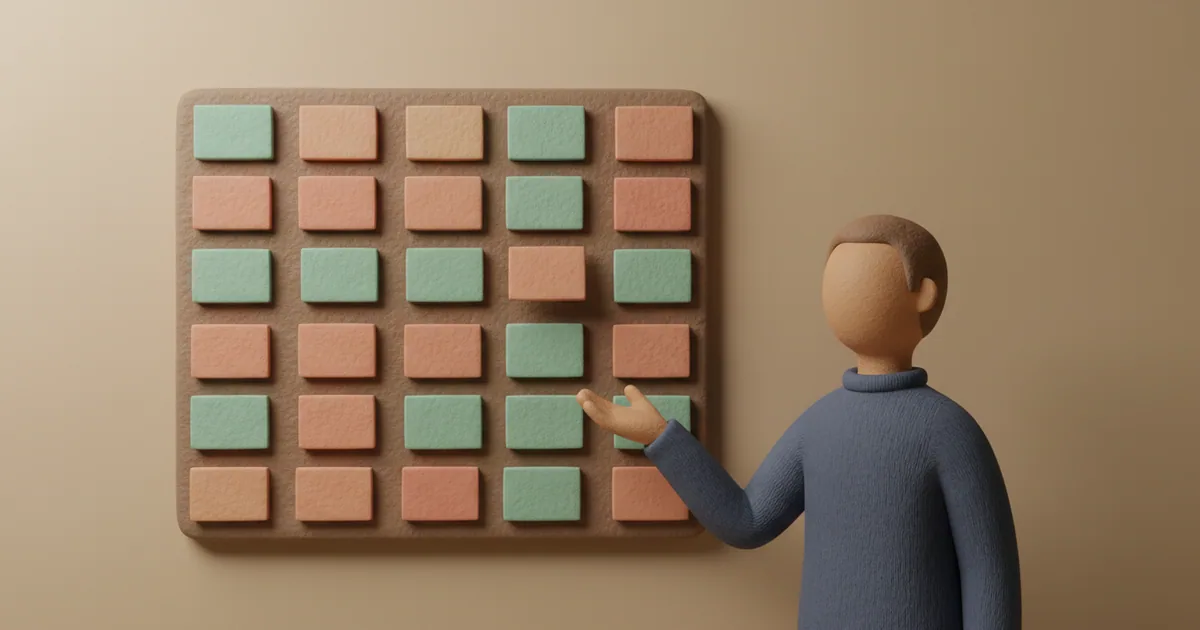
A project dashboard aggregates work items into a visual summary. It answers three questions without digging through tickets: What are we working on? What's blocked? What shipped recently?
The simplest version is a Kanban board with columns for backlog, in progress. and done. More sophisticated dashboards add burndown charts, velocity metrics. and dependency graphs. The best ones connect to your source of truth automatically. Manual dashboards go stale within hours.
In teams that use Linear, a project dashboard typically pulls from Linear's project and cycle data. For customer-facing visibility, you need something that sits on top of Linear and exposes a curated subset without revealing internal priorities or sensitive labels.
Dedicated roadmap and feedback tools create this translation layer. Customers see what's planned and what shipped. Your team sees the full engineering context.
A dashboard that requires manual syncing creates busywork. A dashboard with native integration stays current automatically. If your team lives in Linear, your dashboard tool should pull directly from Linear projects and push approved feedback back as issues.
The best project dashboards serve two audiences simultaneously. Internal stakeholders see granular progress. External stakeholders see curated progress. The data comes from the same source. The views are filtered by audience.
Project Dashboard: Best Practices

Start with your audience. An internal dashboard can show cycle time, bug counts. and team velocity. A customer-facing dashboard should not. Customers care about three things: what's coming, what's in progress. and what shipped.
Structure your dashboard around those states. Use clear labels. "Planned" beats "Backlog." "In Progress" beats "Sprint 47." "Shipped" beats "Done." Your internal terminology confuses everyone else.
Keep visible items under twenty. A dashboard with 200 items is a backlog. Curate ruthlessly.
Use categories and tags to let viewers filter. A customer using your enterprise plan cares about different features than a self-serve user.
Evidence block: Intercom's product team reported in their 2023 engineering blog that switching from a static roadmap PDF to a live dashboard reduced "roadmap clarification" support tickets by 41% in the first quarter after launch.
Enable voting on planned items. Votes give you signal about demand. They also give customers a sense of participation. When someone votes for a feature and later receives an email that it shipped, you create a moment of delight that costs nothing.
Automate status updates. If your dashboard requires manual moves from "In Progress" to "Shipped," it will fall out of sync. Connect to your issue tracker. When an issue closes in Linear, the dashboard should update within minutes.
Publish a changelog alongside your roadmap. Roadmaps show intent. Changelogs show execution. Together they build credibility.
Notify voters when their requested features ship. This closes the feedback loop and turns passive submitters into engaged advocates.
Set a weekly review cadence. Archive stale items. Add new high-priority work.
Use custom branding. A dashboard that looks like a generic SaaS widget undermines trust. Match your brand colors. Host it on a subdomain of your main domain.
Founder's Opinion
If your team uses Linear, your project dashboard should be built on Linear data. Full stop.
I have seen teams maintain separate systems. They use Linear for engineering and a standalone roadmap tool with no connection. The result is always the same: the public roadmap drifts from reality within two weeks. Someone has to manually reconcile. That person resents the task. It gets deprioritized. Customers see "In Progress" for features that shipped a month ago.
The fix is integration at the data layer. Your dashboard tool should read from Linear projects directly. When you mark an issue as done, the dashboard reflects that change automatically. When you create a new project, you surface it on your public roadmap with one click.
The same logic applies to feedback collection. Customer requests should become Linear issues without manual copying. The feedback portal and issue tracker should share a source of truth.
Two-way sync is non-negotiable. One-way import creates orphaned items in both systems.
Combine your roadmap and changelog in the same tool. They serve the same audience. A customer who sees a roadmap item move to "Shipped" should click through to the changelog entry. That continuity builds trust.
Frequently Asked Questions
What is the difference between a project dashboard and a project management tool?
A project management tool is where work happens. It contains tasks, assignments. and dependencies. A project dashboard is a view layer that summarizes progress for a specific audience without exposing every detail. You manage work in Linear or Jira. You communicate progress through a dashboard.
How often should I update my public project dashboard?
If your dashboard connects to your issue tracker with live sync, status changes flow automatically. Review weekly to curate which items appear publicly. Remove stale items. Add newly prioritized work.
Can I use a project dashboard for multiple products or teams?
Yes. Most dashboard tools support multiple boards. You can create separate dashboards for different products or customer segments, each with its own branding and access controls.
What metrics should I track on an internal project dashboard?
Focus on cycle time, throughput. and blocker count. Cycle time shows how long items spend in each stage. Throughput shows items shipped per sprint. Blocker count shows items stuck on dependencies. These three reveal health without drowning you in data.
How do I collect customer feedback and display it on a project dashboard?
Use a feedback portal that lets customers submit requests and vote on existing ideas. Connect it to your issue tracker. Approved requests become issues that appear on your roadmap when marked for public visibility. When the issue ships, notify voters automatically.